Transforming Building Management: Launching our Platform Upgrade
Insight Platform
Introducing the latest improvements to our insight platform following our brand refresh project. Our commitment to unifying the look and feel of our products has led to significant changes aimed at elevating your experience. These enhancements are designed to simplify alignment with compliance, streamline ESG reporting, support efficient energy management, and precisely gauge and report carbon reduction initiatives.

What’s New?
1. Seamless Navigation with the New Side Menu
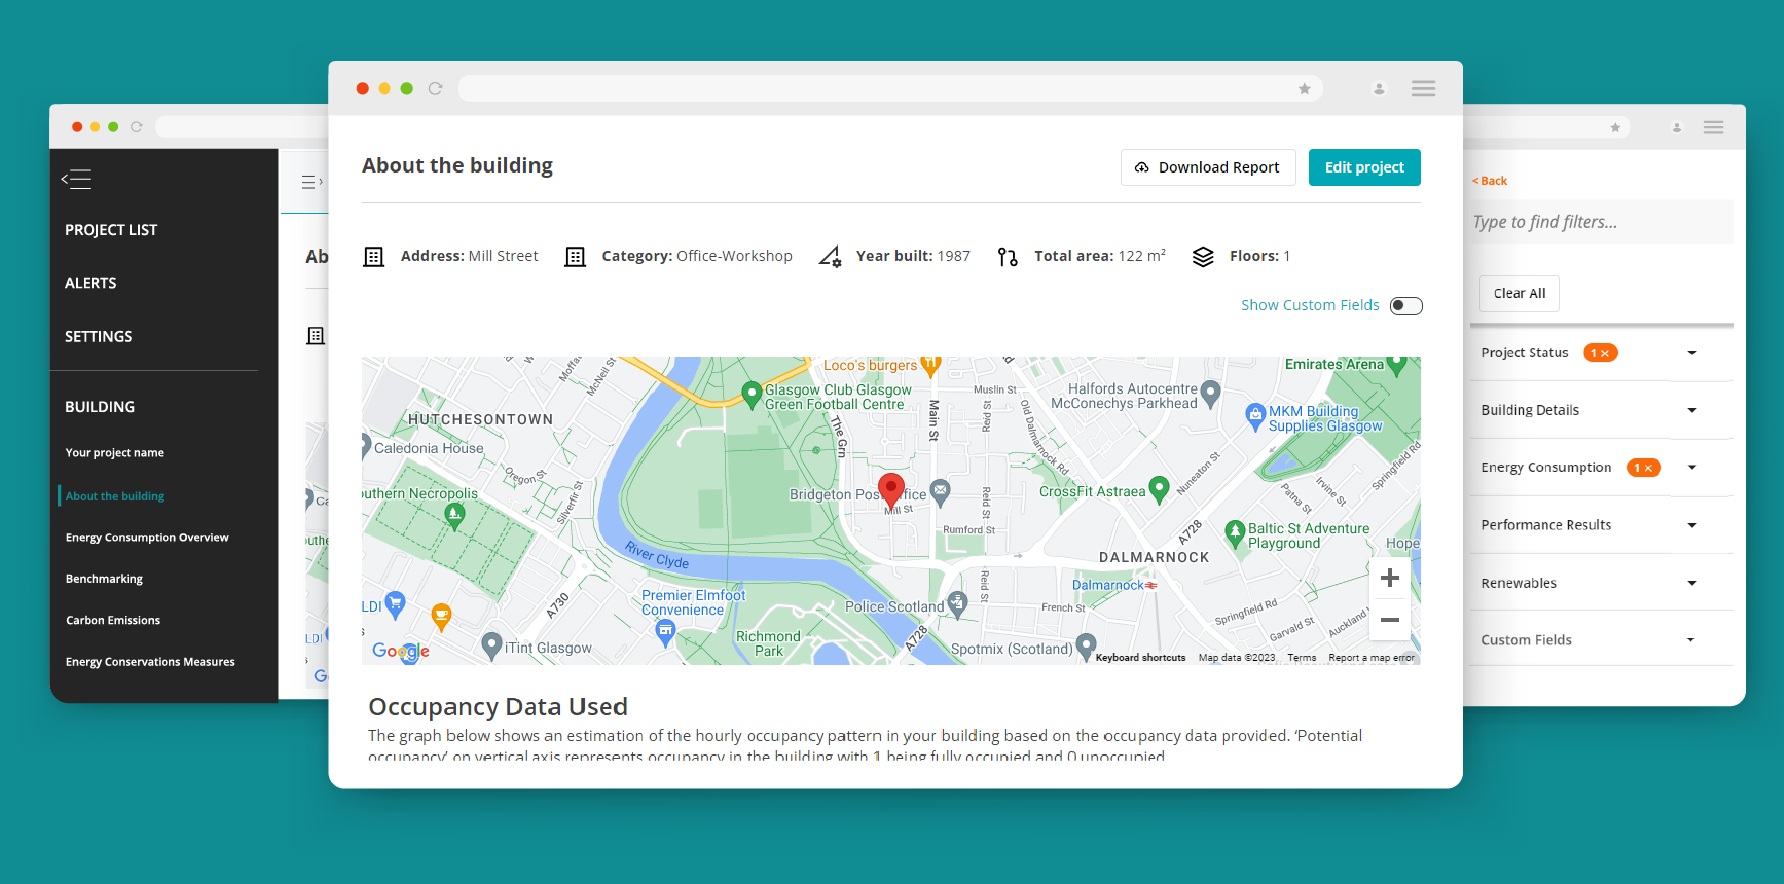
Introducing our brand-new side menu that streamlines the transition between your portfolio and individual project views. With easier access to vital information, that will empower users to make better decisions, that support building energy performance goals.
2. Maximise Screen Space with the Collapsible Menu
Now, you can expand your perspective by collapsing the side menu, providing you with a spacious and unobstructed view of your project results. Dive deep into the data without any visual distractions.
3. Elevated Control with the Enhanced Settings Menu
Managing your platform settings, account preferences, and project sharing has never been this intuitive. Our updated settings page, complete with three user-friendly sub-tabs, ensures that you’re always in command. Effortlessly share projects with designated managers and oversee access privileges to foster a collaborative environment.
4. Empower Your Management Team with Enhanced Manager Controls
With our enhanced manager tab integrated into the settings menu, you can add new team members, share projects, and fine tune access permissions to fully support users to get the most out of the platform based on their needs and roles.
5. New Project List Page: Enhance Visibility, Enhanced Efficiency
With the all-new project list page, you are presented with a comprehensive view of your projects. Locked header columns ensure you’re always clear on the information you’re reviewing, whilst optimised column sizes provide ample room for data—no more endless scrolling!
6. Tailor your view with Column Customisation
Flexibility meets functionality. Shape your workspace to align with your unique objectives. Seamlessly hide, sort, and resize columns with a simple arrow click.
7. Actionable Insights and Management Made Easy
Revolutionise your building management approach with our upgraded checkbox feature on the project list. Whether it’s decluttering your dashboard or generating insightful reports, you’re in control, helping you achieve a new level of efficiency when evaluating your portfolio.
8. Enhanced Filter System
Filtering precision with our revamped options:
-
-
- Project Status: Amplify your understanding with new filters like processing, editing, incomplete, complete, and waiting for 3rd party response.
- Building Details: Tailor your focus with filters spanning building type, area, zip code, country, year built, and year renovated.
- Energy Consumption: Fine-tune your energy strategy by filtering through fuel types, data resolution, energy upload dates, and annual energy consumption.
- Performance Results: Drive results with filters covering energy star scores, energy use intensity, carbon emissions, and wastage.
- Renewables: Seize renewable opportunities with filters for PV or storage options.
- Custom Fields: Adapt the platform to your needs by adding custom fields and reorganising projects for maximum efficiency.
- Clear All Filters: Regain clarity instantly by resetting all filters in one swift click.
- Save Filter Combinations: Optimise your workflow by saving specific filter combinations for future reference.
-
Our enhanced capabilities give you the time saving tools needed to bring clarity to your portfolio’s energy performance, enabling you to take effective decisions about energy efficiency and carbon reduction.
9. New Features in Project Results
Access vital building information through the new ‘About the Building’ page and create energy efficiency reports. Furthermore, the ‘Download Report’ feature provides insights into energy usage and actionable recommendations for enhancing your energy strategy. While the enhanced Energy Consumption Overview page offers detailed graphs showcasing total consumption, disaggregated data, and potential wastage, empowering users to identify areas for improvement and optimise energy efficiency.
10. Dynamic Graphs
This feature enables a deeper data analysis with zoom capabilities. Hovering over points reveals specific data details.
Ready to find out more?
To ensure you make the most of these exciting updates, we have prepared a comprehensive guide located on the bottom left of the screen once logged into the platform. This guide has been designed to help you navigate through the latest enhancements effortlessly and explore the innovative features now available to you.


